You’ve probably viewed hundreds of reports by now from your dental practice management software – production totals, collections, receivables, and maybe even a missed appointment list if possible. (In a recent blog, I provided samples of these types of standard reports as well as specific transaction tracking features that are essential for running a well-informed, financially successful practice.)
Yet, have you ever wished you could change the format of some of your reports or wondered whether you should be getting more out of the software that’s holding so much practice data in its database? This blog will address these issues by outlining some external reporting methodologies you can employ to shed new light on how your practice is performing.
1. Enhancing Your System’s Standard Reports
One of the limitations of the standard reports is that the output format is essentially fixed – what you see is what you get. As a first step to producing more revealing reports, contact your dental software vendor to find out whether you can export your report data to a folder on your computer. If so, you should be able to view the folder’s file content in other programs such as Microsoft Word or Microsoft Excel.

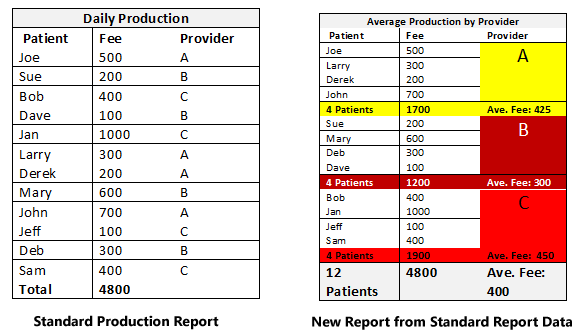
With a little knowledge of these applications, you will be able to perform additional calculations on your practice data and benefit from using news ways of presenting the results. For example, with Excel you can get sums or count totals for any chosen set of data and that can give additional context to the original standard report. You can also use Excel or Word to format the report according to your preference. Let’s look at a simple example to illustrate the possibilities:

From the above example, you can see that the same data from a standard report can be used to provide metrics with additional context. In this case, after utilizing the capabilities of Excel we now have a patient count well as the total and average production by provider.
In short, your practice management software still performs the work of gathering and compiling the data but by using these powerful productivity tools, you can produce new metrics that help you better manage your practice.
2. Visual Reporting with Power BI
Would you like to go a step further by transforming your practice data into easy to read visual reports?

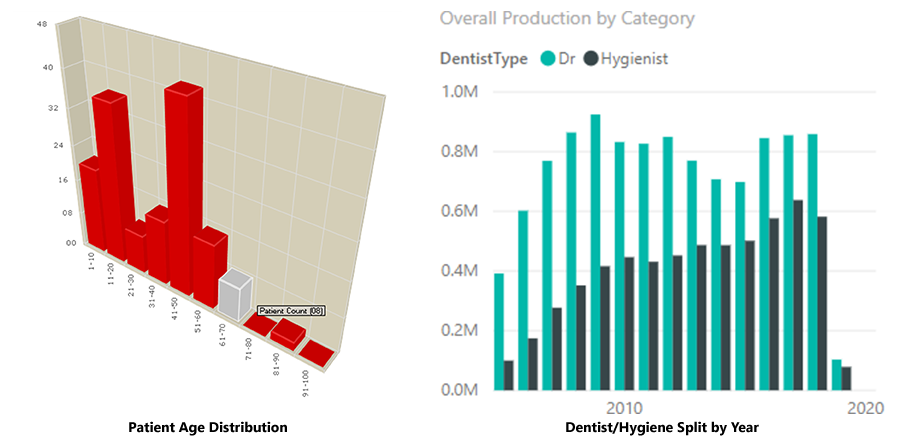
Microsoft Power BI is a business analytics platform that can monitor and read the important data from your dental software database. It provides tools to quickly analyze, transform and visualize data into meaningful reports, key performance indicators (KPIs) and dashboards.
Note: You will need some basic Power BI training and assistance from your software vendor to ensure you extract the data you require. Here are two sample reports that illustrate the possibilities:

3. The “I’m not that Technical” way of producing KPIs
If you don’t want to invest time learning how to use the above mentioned tools to produce the Key Performance Indicators (KPIs) you need, don’t fret.

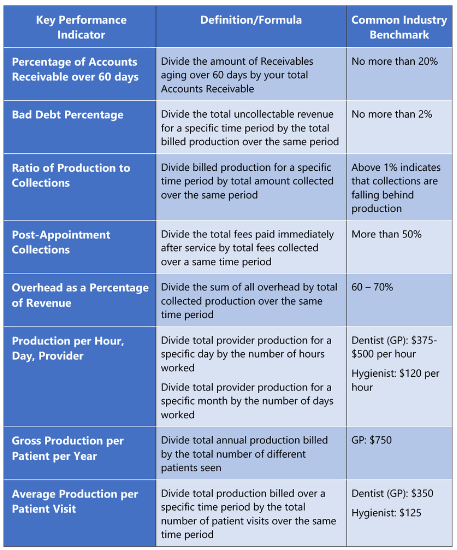
With a few simple manual calculations you can likely produce at least some of the customized reports that you require.Below is a list of financial based KPIs I mentioned in a previous blog:

In short, the exercise involves manually extracting one or more numbers from the relevant standard reports and then performing simple calculations as described in the above chart. For a list of Operational KPIs, check out this previous blog and for Patient Satisfaction/Service Level based KPIs, try this blog.
In summary, your ability to extract the information you need and produce the metrics for running a better practice depends on four main factors:
- Your comfort level for using the productivity tools at your disposal
- The number and quality of the standard reports your dental software produces
- The ability to extract information from your dental software database
- The degree of assistance you receive from your software vendor
On a parting note, simply producing dental practice metrics is not enough. To compete in today’s dental marketplace you need to compare your results to industry benchmarks. And, then make corresponding behavioural and operational adjustments in areas where you are not satisfied to improve those results – but that’s a blog for another day!


